Use it to guide every decision you make
Microsoft Office tools are becoming more and more powerful with each update. Nowadays, you don’t even need a dedicated app for flowcharts. You can make flowcharts in PowerPoint, Word, and even Excel.
We’ve already covered flowcharts in PowerPoint. So in this article, we’re going to show you how to create a flowchart in Word and Excel. We’re going to use Microsoft Office 2019 for the demonstrations, but you can follow the same steps using Office 2010 or Office 365. If your Microsoft Office suite version isn’t older than 2007, you can create flowcharts using our methods.
How to Create a Flowchart in Word Using Shapes
Microsoft Word is a popular word processor used everywhere in the world because it’s compatible with all computers. Over time, Word evolved into something more than a simple word processor, steadily increasing its popularity on all platforms. Now it comes with drawing tools and design tools as well, so you can create flowcharts, generate barcodes, and even create greeting cards.
One of those tools is Shapes. Using the Shapes tool is the easiest way to create a simple flowchart on the go. So let’s start with a basic flowchart using Shapes.
Start With a Blank Document
When you launch Microsoft Word, you’re automatically given the option to open a blank document. Simply click on the Blank document option and you’re good to go.
Enable Gridlines
This step is optional but we recommend it because it makes everything easier. Gridlines will help you size everything properly and place each flowchart element correctly. Without this feature, you might end up with uneven shapes and misaligned drawings that will make your flowchart look unprofessional.
To enable gridlines, go to the View tab and click on the Gridlines checkbox.
Your document will now look like in the image below.
Insert Shapes
Go to the Insert tab and click on the Shapes button to display Word’s collection of shapes.
You’ll notice several categories of shapes.
We’re interested in Lines and Flowchart shapes to create our flowcharts. Each shape is used for a different purpose. While the rules aren’t set in stone, it’s good practice to follow Word’s recommendations. For example, you should use the rectangle for process steps and the diamond shape for decision points. You can find this information by hovering your mouse pointer above each shape.
Now, let’s add the first shape. Let’s start with an oval shape. Open the shape menu, select the oval, and draw it by clicking and dragging your mouse pointer.
After you draw your first shape, you’ll notice a new tab at the top of the document. You gained access to the Format tab, which you’re going to use to modify your shapes, add colors, and more.
To add text to your shapes, right-click on the shape and select Add Text from the menu.
Now let’s add another shape and then link them together by using a line as a connector.
Follow the previous steps to insert a rectangle shape.
Next, go to the shape library, and instead of choosing a shape from the Flowchart category, select a line arrow from the Lines category.
Select the first shape to see the control points on each side of your shape and then select the arrow. Click on the low-bottom handle and drag the arrow to the second shape’s center handle.
Repeat these steps using any shapes and lines you want to create your flowchart.
How to Create a Flowchart in Word Using SmartArt
SmartArt is a newer feature that comes with premade layouts for flowcharts, organization charts, Venn diagrams, and much more. While the Shapes tool is enough to present your ideas, SmartArt takes it to the next level with a more professional look and saves you some time.
Create SmartArt Graphic in Word
Create a new blank document and enable gridlines as you did earlier.
Go to the Insert tab, and two steps away from the Shapes button you’ll find SmartArt.
Click on SmartArt and a template window will open. Word offers a wide variety of SmartArt graphics, but we’re interested in the Process section.
Select Picture Accent Process in the Process category and click on the OK button. This template is used to visually present a workflow or a step-by-step process.
This option generates shapes that can contain images, text, and arrows that link them in a logical order.
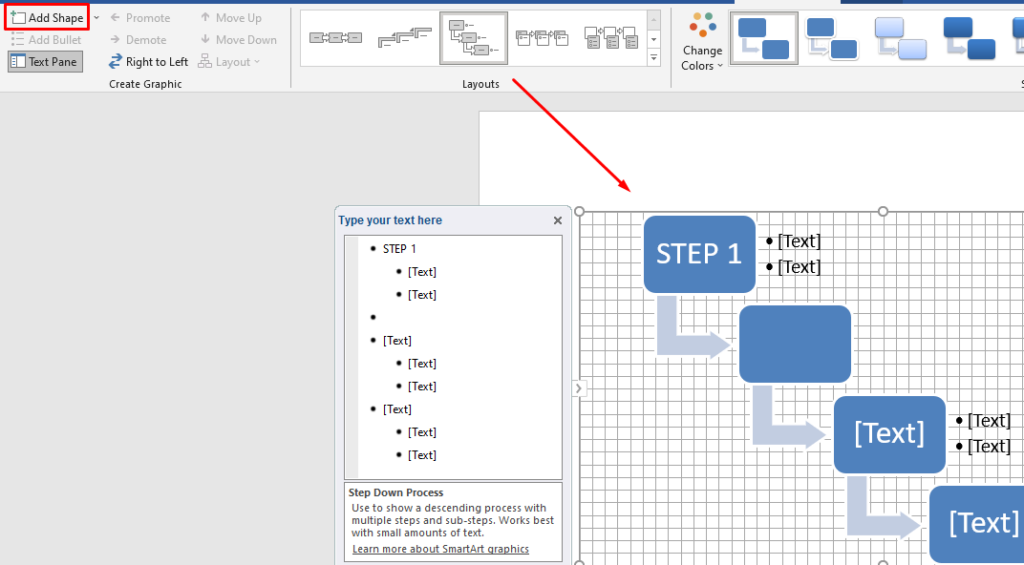
Next to the flowchart, you’ll also see a window with flowchart editing options. You can click on the text pane to insert text and on the corresponding image shape to insert a new graphic.
You can also modify the SmartArt design after generating it. You can insert new shapes from the Add Shape button in the top left corner, change layouts like in the above image, add new colors, and more.
Creating flowcharts with SmartArt templates is a much faster process than inserting shapes manually and the end result looks more professional. However, sometimes using shapes from scratch is the better option because you have full control over design and customization.
How to Create a Flowchart in Excel with the Shapes Tool
Microsoft Excel isn’t just for creating spreadsheets and doing math. It supports a variety of graphics generating tools used to make charts, histograms, graphs, and much more.
If you use Excel more often than Word, you might as well use it to create flowcharts. The process is basically the same as in Word. Here’s how you can create a flowchart from scratch using the Shapes tool.
Set Up the Grid
Whether you create flowcharts in Excel or Word, always create a flowchart grid. It helps you position your flowchart shapes properly.
To set up a grid in Excel, start by changing the widths of the column. An Excel worksheet is already a grid, you just need to tweak it. The column width should be equal to the height of the row.
Start by selecting all the cells by clicking on the top-left corner button on your worksheet.
Next, select the Format button in the Cells section of the Home tab and select Column Width from the menu.
By default, the height of the rows is set to 15 points (20 pixels). To have 20 pixels in width, set the column width to 2.14 and select OK.
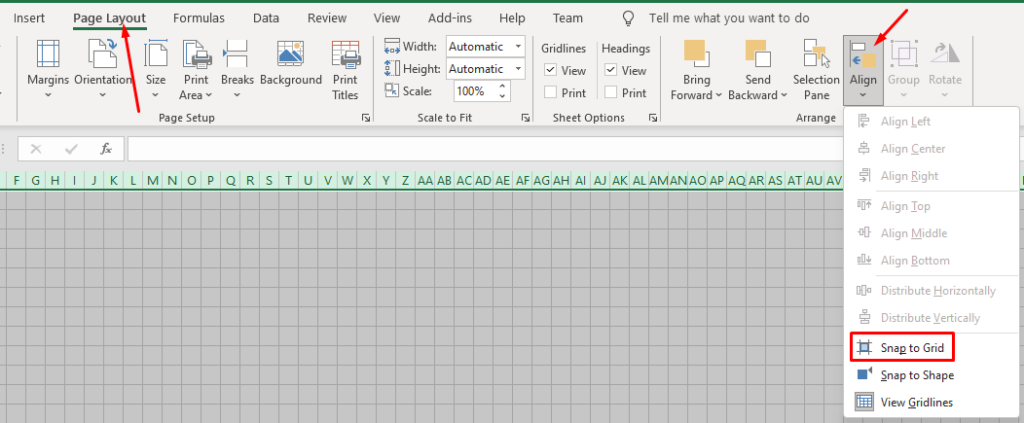
Now we have a grid, but it doesn’t work like the one in Word. We need to enable the Snap to Grid feature to make shapes automatically align themselves to the closest grid line.
Go to the Page Layout tab and select Align. Select Snap to Grid from the new menu.
Insert Shapes
Adding shapes in Excel works exactly like in Word.
Go to the Insert tab, click on the Shapes button, and select your first Flowchart shape.
Draw the shape by dragging your mouse pointer.
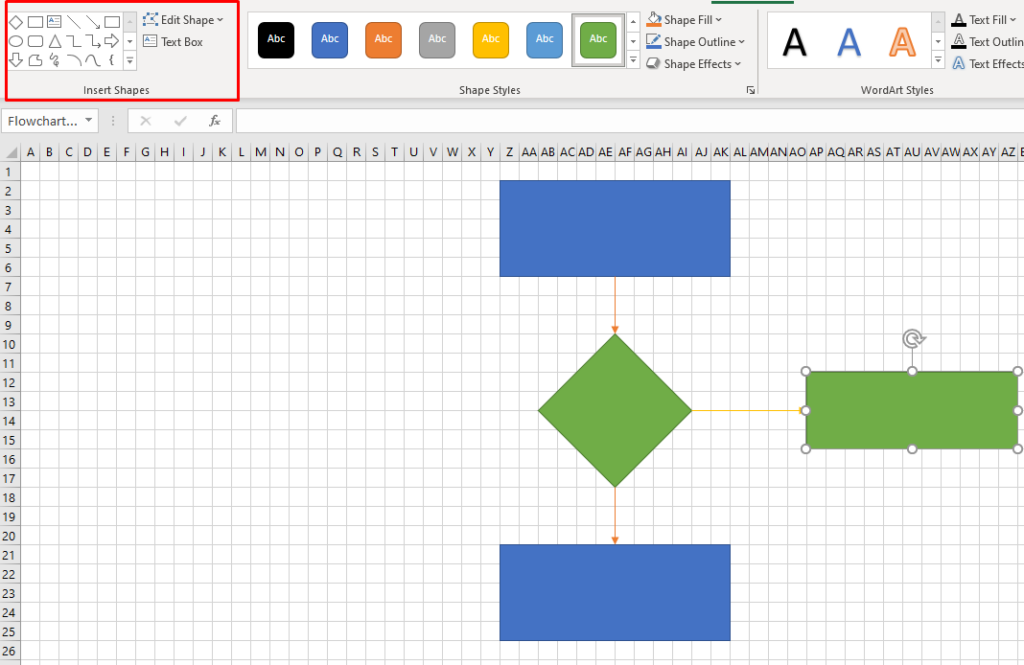
You’ll notice the Shape Format tab appearing at the top. As you can see in the image above, it’s identical to the one in Microsoft Word. All the controls, options, and buttons work exactly the same.
You can select another shape from the Insert Shapes section in the top left corner and add it under the first one. Then connect them with an arrow, change their colors, and continue adding more shapes to complete your flowchart.
How to Create a Flowchart in Excel Using SmartArt
The fastest way to create a flowchart in Excel is by using SmartArt graphics. This feature works just like in Word and the steps you need to take to create a SmartArt flowchart are basically the same.
Create SmartArt Graphic in Excel
SmartArt in Excel is the same as in Word. Go to the Insert tab and click on the SmartArt button.
A window with SmartArt flowchart templates will open. It looks exactly like the one in Word. There’s no difference between the two, so refer to our section on how to create a flowchart in Word using SmartArt if you need help. All the flowchart formatting and editing options are identical as well.
What’s Your Favorite Flowchart Making Tool?
Microsoft Word and Excel are equally great for designing flowcharts and you can use SmartArt graphics with both. Which one do you prefer to make flowcharts? Tell us in the comments below which is your favorite software for creating flowcharts and why.


